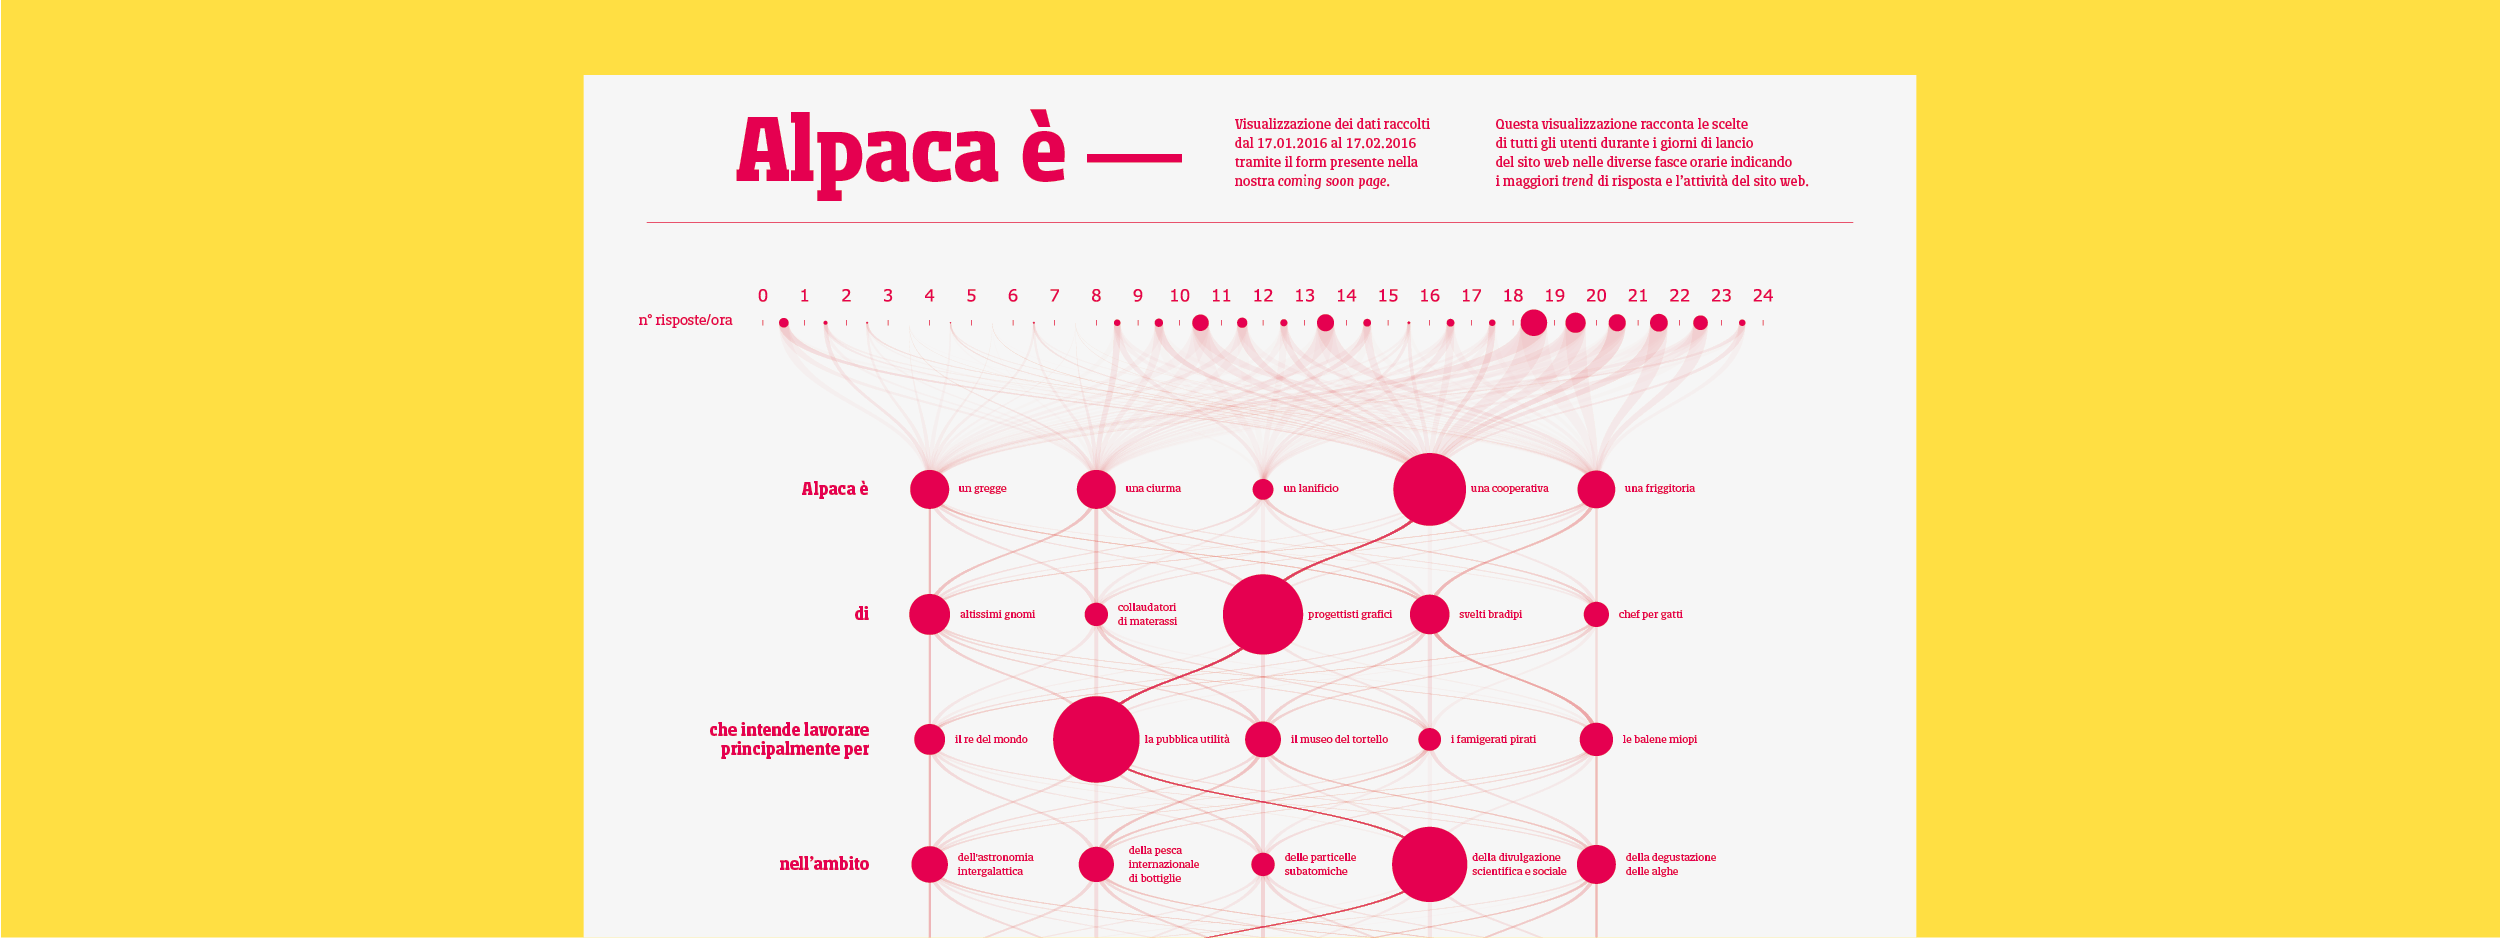
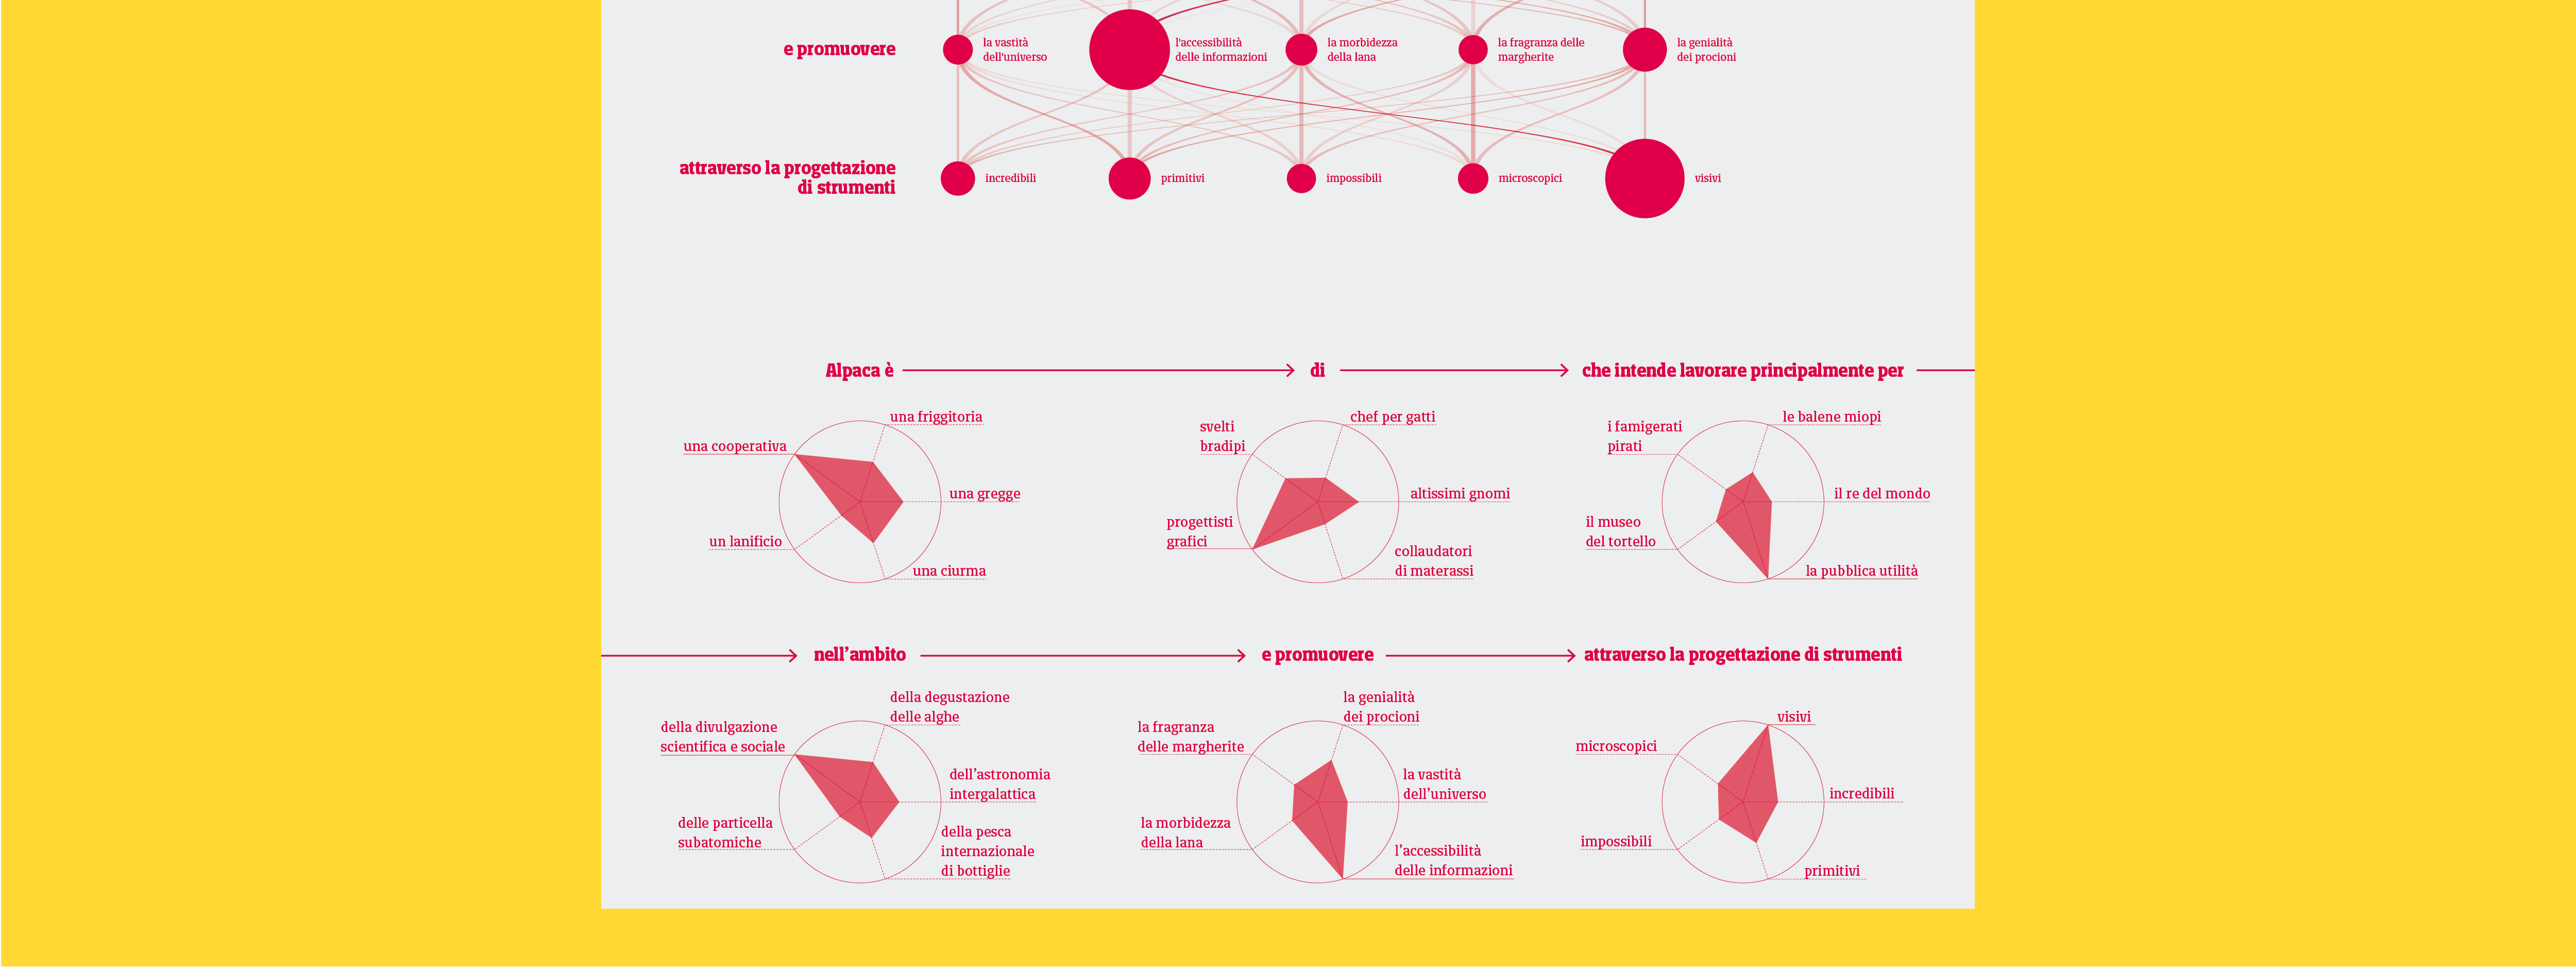
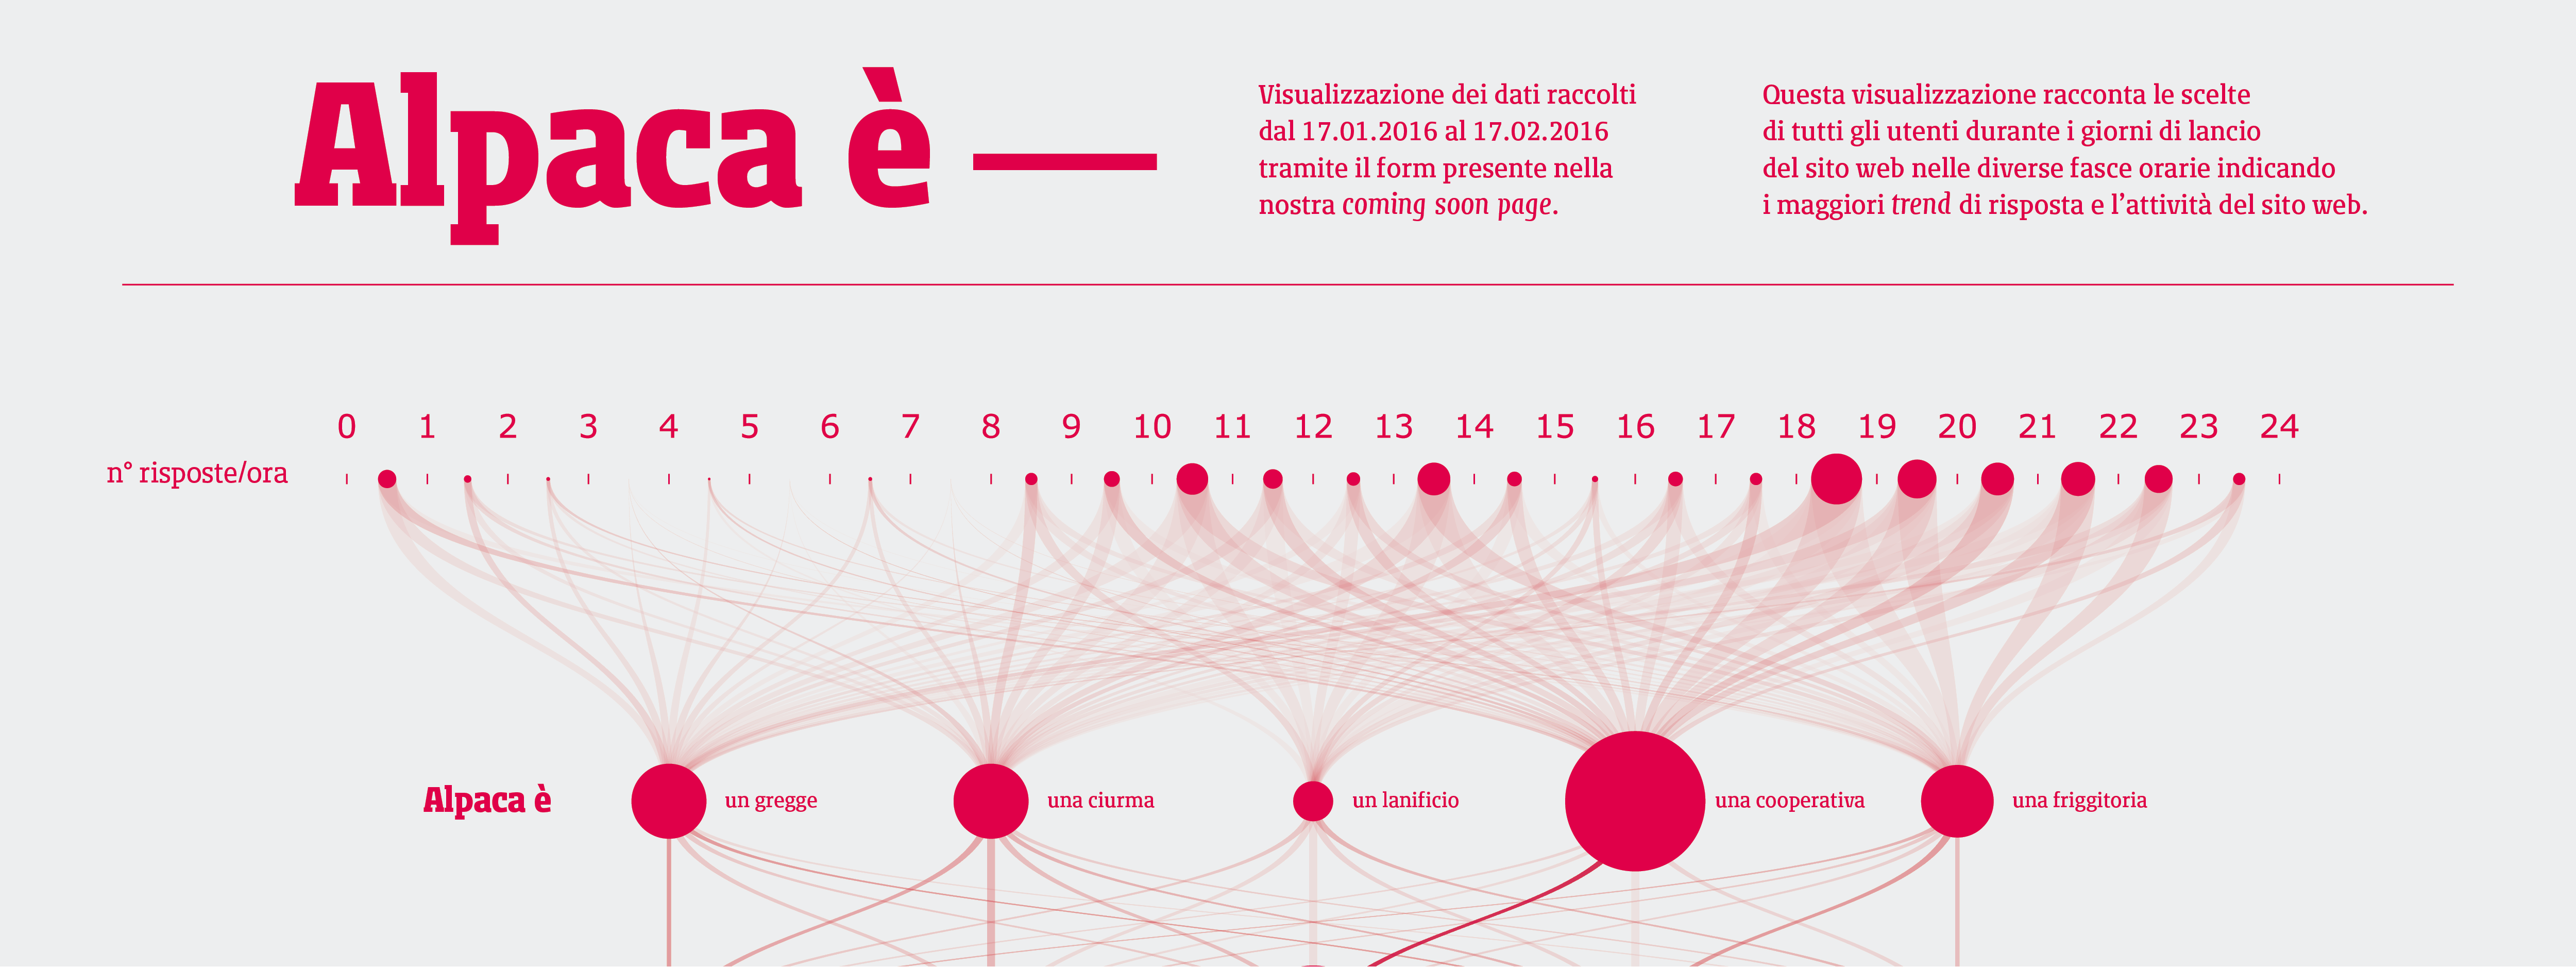
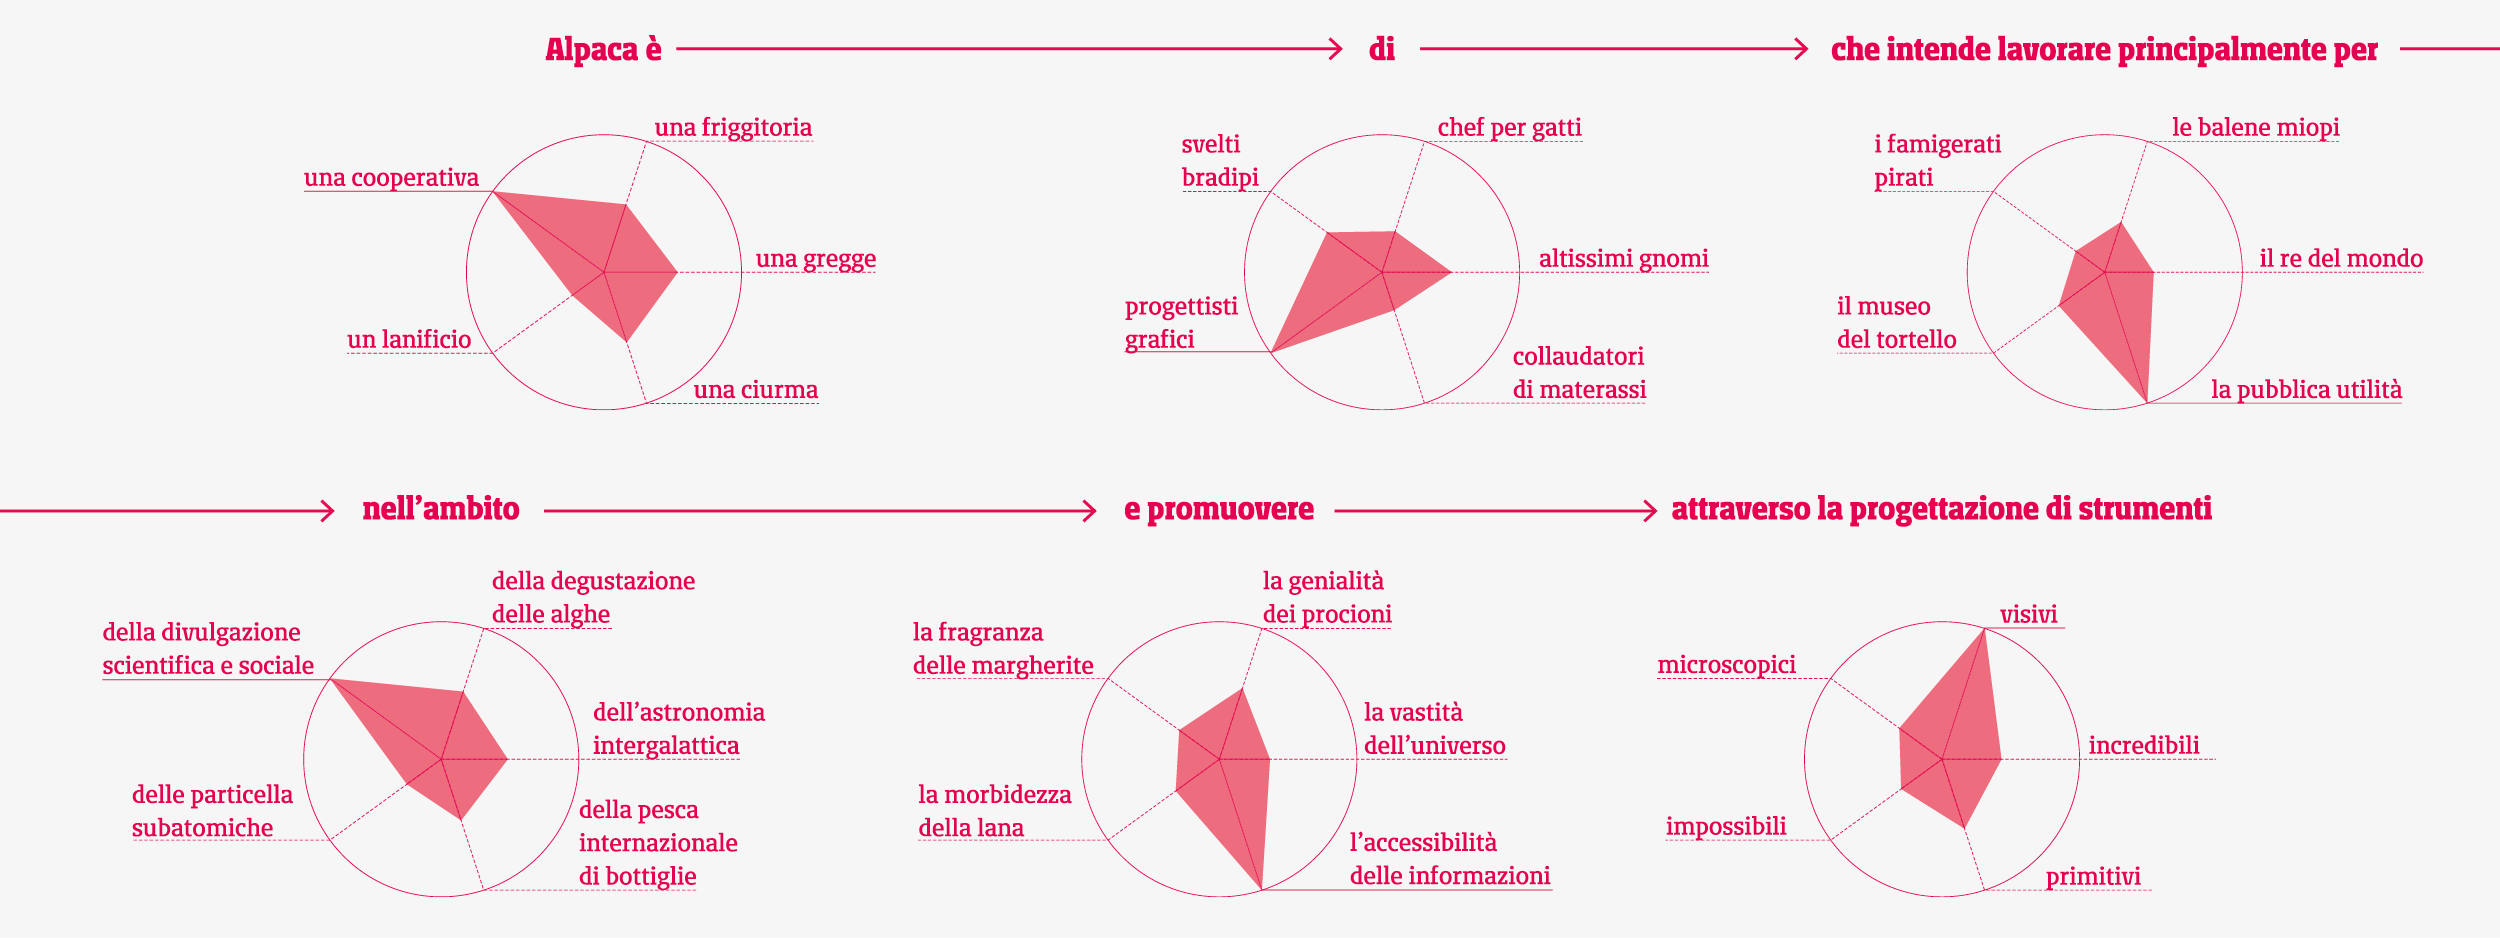
During the first month of the website launch we developed a coming soon page that allowed, through unusual multiple-choices, to describe what Alpaca is. Once the custom sentence has been completed, we anonymously collect the choices of every user in a spreadsheet. On the occasion of the Alpaca’s institutional website launch we design this data visualization that collect 440 user’s choices.
The visualization gathered data from 17.01.2016 to 17.02.2016 through the form in our “coming soon page” at alpacaprojects.com. This data visualization shows the choices made by all the users in different hours during the website launch days, showing the answer trends and the website activity.
